Embedding graphs from this webpage using iframe
This text describes how to use iframe to embed any graph and make your own reference to any graphical representation on our webpage.
Why use embedding graphs?
On this webpage there are plenty examples of graphs presenting the statistical data on health and welfare. All graphs are designed to collect data from our database, and the editorial groups produce and monitor most of the pages for editing and updating whenever the statistical data is updated.
The graphical module on the webpages is designed to provide users of this information with a collection of options for disseminating the presentation of data. There are many different formats for copying the graphs in various formats such as jpg, pdf and more.
However, we find that it is also relevant to provide the option of embedding graphs, meaning that the webpage provides the option for copying a live graphical representation, including link to the database unto another webpage.
How to get the code for embedding a graph
Here we demonstrate how to copy the necessary information from our graphs for you to insert into your own webpage.
As there are many ways to insert this information onto webpages, we cannot provide any examples on how to insert this data on you own webpage. But with the right technical expertise, it is possible to have your own live copy of any of our graphs on your own webpage, providing options for access to the statistical data.
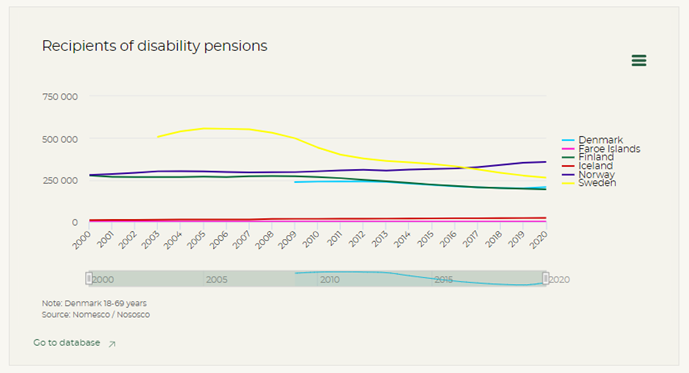
To demonstrate how to get the information for embedding a graph, we show you an example using one of the many graphs on the webpage.
In the top right corner of any graph, you find the menu-button (three lines).
When you press the menu-button, you will see a list of several options for copying the graphical image.
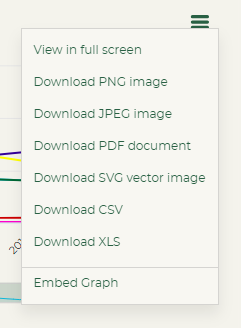
The last option on this list is the “Embed Graph” option.
When you select the option “Embed Graph” a small window appears on the screen. It will look like the following, but this can change according to the browser you are using.
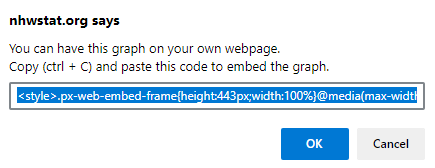
You will notice that the text in the box in marked already, and you are therefore able to copy the entire text by pressing the keys Ctrl + C.
Press the button OK or Cancel to close the box.
When you have copied the text, you will find that the clipboard contains the following code:
<style>.px-web-embed-frame{height:443px;width:100%}@media(max-width:610px){.px-web-embed-frame{height:620px}}</style><iframe class=px-web-embed-frame src=">>link to graph<<" frameborder=0></iframe>
This code needs to be implemented / inserted into your own webpage before the embedding of the graph will function properly.
A note on the code for embedding
The code that you copy from the webpage for embedding the graph consists of two components: Style and iframe.
The style section contains information on the size and proportions of the graph.
The iframe section have the information on the link to the graph that is embedded into the webpage.