How to use Nososco Hypothetical Household tool
Introduction
The Nososco Hypothetical Household tool (abbreviated NoHH) provide access to unique data on hypothetical household income from the Nordic countries.
The Nososco Social benefits group stands behind the data and the development of the NoHH tool. For several years this working group have made calculations based on relevant household types and income levels, and data covering the period from 2007 is available for most of the Nordic countries in Nososco.
What is unique about this tool is that is gives complete access to data on i.e., gross income, disposable income, taxation, and rental costs for relevant household types and provide calculations for the level of compensation in the event of changes in household income due to i.e., childbirth, unemployment, pensioning and more. Furthermore, it gives the user access to graphical presentations of data and dataset – and all is downloadable.
The relevant household types reflect common households in the Nordic countries. The household types are singles with or without children, and couples with or without children. For households with children, it is one child for a single person household and 2 children for a household with couples.
When using this tool, please be prudent and remember to cite the tool using the following: Nososco Hypothetical Household tool, version number and date of data.
Version number and date of data can be found on each panel within the tool.
Select data
The first step before accessing data and graphs is to select data.
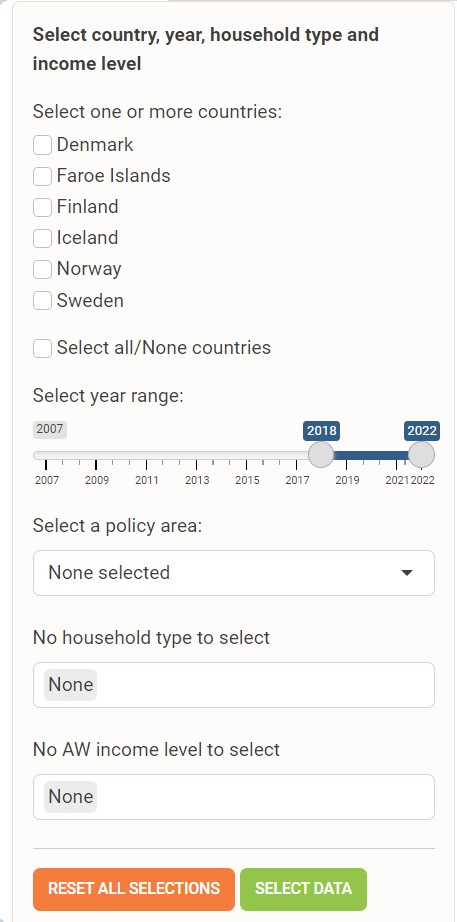
There are five important choices to make:
- Select a country or several countries for comparison of data.
- Select the range of years that the data should cover. Data is not available for all years for all countries.
- Select the social policy area of which you are interested. This will provide data for comparison between employment and the policy area.
- Select which type of household you want to look at. For some policy areas more than one household type can be selected.
- Finally select the level of income to look at. The options available are determined by the selection made under point 3 and 4.
When all five options are selected a sign of “OK” is shown to the left of each option on the right side of this panel.
To move forward, you must press the green “Select data” button.
If you change the selected values, you must press the Select-button to update the selection of data.
To remove all selections in the tool, press the orange “Reset all”-button in this panel.
When you have selected data, you are able to have it presented in tabular form or as graph on the other panels. The other panels show different aspects of the selected data.
Data on benefits
In this panel you will find detailed information about the monthly level of benefits from social policies in the Nordic countries.
The data on this panel show the basic information on the elements of income, taxation, and costs. This is useful if you want to compare the level of benefit i.e., unemployment, sickness benefits or pensions in the Nordic countries.
But you can also select i.e., taxation, child allowance or rental costs, the latter only available for the policy area of social assistance.
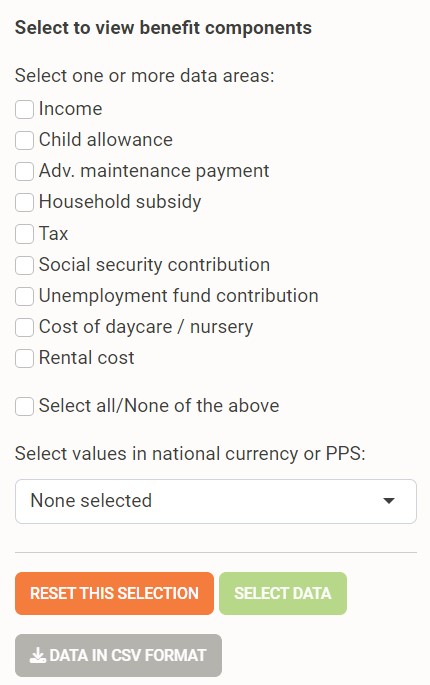
- In the check boxes you select data area(s) of interest.
- The data is presented in either national currency or PPS. The Purchasing power standard represent the value of the data using an indicator of the value measured in PPP/Euro which makes the level of national currencies more comparable.
- Press the “Select data”-button to have the data presented as table and the option for viewing data as a graph is activated.
If you change the selected values, you must press the Select-button to update the selection of data.
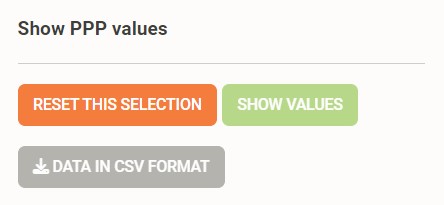
To remove all selections on this panel only, press the orange “Reset this selection”-button in this panel. You can also download the selected data in csv-format.
Income from benefits
If an aggregated level of benefits is of interest, then this panel is relevant. Here the tool presents the benefits in designated groups showing the difference in income, taxation, and costs.
Also, the disposable income for benefits and a rate of net income compared to gross income is presented.
This kind of comparison inform about the budgetary situation of Nordic households and compare the level of income, taxation etc. and the disposable income for households and income levels.
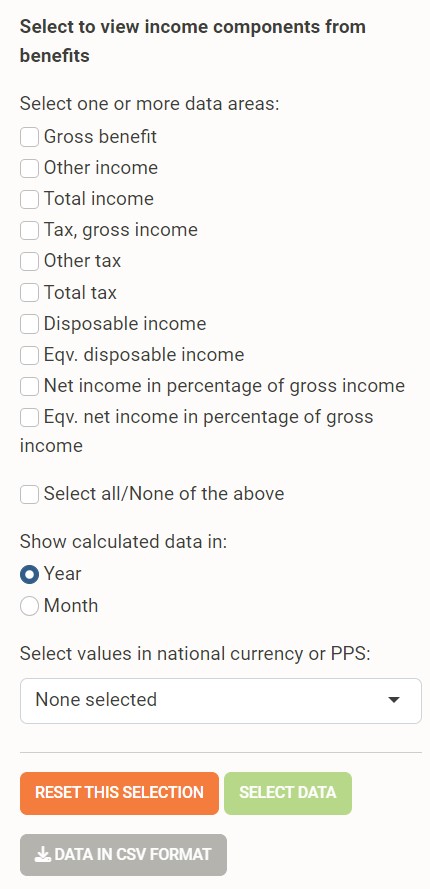
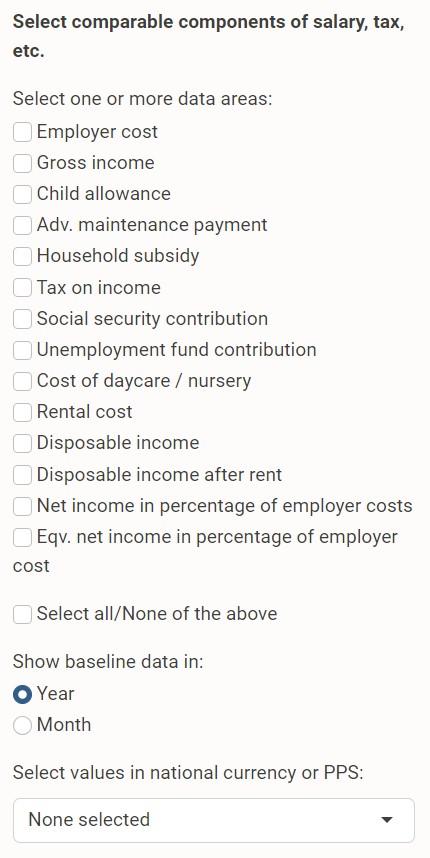
- In the check boxes you select data area(s) of interest.
- It is possible to compare figures on yearly or monthly basis.
- The data is presented in either national currency or PPS. The Purchasing power standard represent the value of the data using an indicator of the value measured in PPP/Euro which makes the level of national currencies more comparable.
- Press the “Select data”-button to have the data presented as table and the option for viewing data as a graph is activated.
If you change the selected values, you must press the Select-button to update the selection of data.
To remove all selections on this panel only, press the orange “Reset this selection”-button in this panel. You can also download the selected data in csv-format.
Compensation rates
Is it possible to measure the strength of social policies in the Nordic countries? The answer to this question may depend very much on the context.
However, one way of illustrating the goal of social policies to counter impoverishment and budgetary difficulties for recipients is to measure the level of disposable income from a social benefit compared to the disposable income from employment. For this we use compensation rates.
A compensation rate expresses the percentage of disposable income available after receiving a social benefit compared to the disposable income from employment. This is calculated for relevant instances of household types and income levels.
The compensation rate tells the story that in most cases the Nordic countries provide a level of income from social benefits, that support low-income groups and single parents to a higher degree than high-income groups and households with couples.
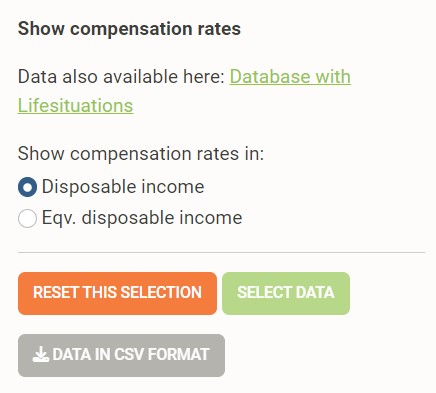
- You can either select the compensation rates based on disposable income or equivalised disposable income. The latter is only different when the household type changes i.e., when a comparison is made for the policy area of Childbirth.
- Press the “Select data”-button to have the data presented as table and the option for viewing data as a graph is activated.
If you change the selected values, you must press the Select-button to update the selection of data.
To remove all selections on this panel only, press the orange “Reset this selection”-button in this panel. You can also download the selected data in csv-format.
The data on compensation rates on disposable income is also available in the NHWStat database and is presented in the section named “Life situations” on our webpage.
Income from work
What is the level of income from employment across the Nordic countries?
This question can now readily be answered within this panel of the tool.
Here the working group present the components of income from employment, including calculated employer costs, taxation, and various mandatory contributions and costs.
Also, there is a calculation of the level of disposable income and the net income in per cent of employer costs.
With this data it is possible to compare the budgetary situation for Nordic households in regular employment, and it is possible to make detailed analysis of income situations for a broader range of the Nordic societies. A practical example of the use of these data in in the “Cost of living in a crisis”-analysis, which have been presented by members of the working group at the Nordic Welfare Forum in Reykjavik in 2023.
- In the check boxes you select data area(s) of interest.
- It is possible to compare figures on yearly or monthly basis.
- The data is presented in either national currency or PPS. The Purchasing power standard represent the value of the data using an indicator of the value measured in PPP/Euro which makes the level of national currencies more comparable.
- Press the “Select data”-button to have the data presented as table and the option for viewing data as a graph is activated.
If you change the selected values, you must press the Select-button to update the selection of data.
To remove all selections on this panel only, press the orange “Reset this selection”-button in this panel. You can also download the selected data in csv-format.
Purchasing power parities
The aim of Nososco in general is to make available comparable knowledge and statistics from the Nordic countries.
But having different currencies in the Nordic countries make it difficult to compare the level of i.e., income or sizes of benefits.
Therefore, we use the indicator named Purchasing Power Parities (PPP/Euro), provided by Eurostat, to recalculate figures with respect of the estimated purchasing power in Euro, thus creating the PPS (Purchasing power standard).
This way we can adjust the data and provide a supplement (in PPS) that tell a story about if and how i.e., the income or level of benefits are identical across the Nordic countries.
Based on the selection of countries and range of year, a press on the “Show values” button provide the data in tabular form and as a graph.
The figures for PPP/Euro are updated at least once a year, and whenever possible, the entire range of indicators are adjusted to make sure that the calculated figures are up to date.